INVOKANA® demonstrated A1C, body weight, and systolic BP reductions for up to 6.5 years in adult patients with T2D1
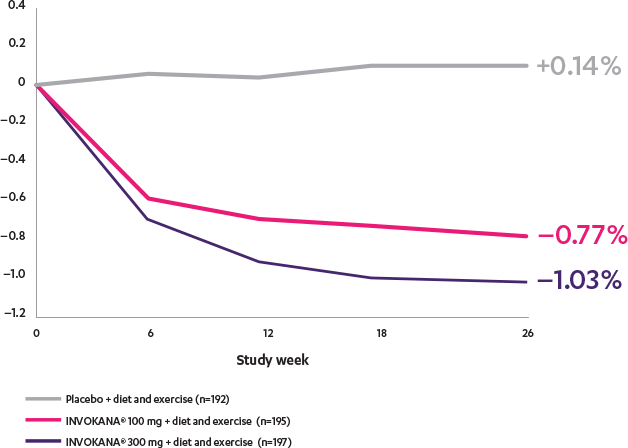
INVOKANA® helped lower A1C in adult patients with T2D in need of glycemic control2
Adjusted mean change from baseline in a monotherapy study2

In patients with an eGFR ≥60 mL/min/1.73 m2 needing additional glycemic control, the dose can be increased to 300 mg once daily.3
As demonstrated in 10,142 patients in the longest CV outcomes program for a type 2 diabetes therapy,
INVOKANA® reduced A1C, body weight, and systolic BP for adult patients with T2D1
CANVAS
![]()
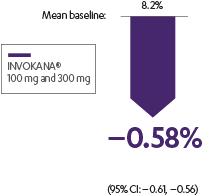
A1C: placebo-subtracted mean change from baseline

- The INVOKANA® group received 9.3% fewer additional AHAs during follow-up than the placebo group (95% CI: –11.0, –7.6)1
- Use of background therapy for glycemic management and other control of risk factors were guided by best practice according to local guidelines1
![]()
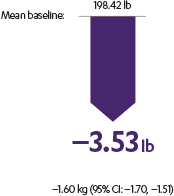
Body weight: placebo-subtracted mean change from baseline

- Sustained effect for up to 6.5 years1
![]()
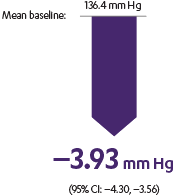
Systolic BP: placebo-subtracted mean change from baseline

- Sustained effect for up to 6.5 years1
![]()
A1C: placebo-subtracted mean change from baseline

- The INVOKANA® group received 9.3% fewer additional AHAs during follow-up than the placebo group (95% CI: –11.0, –7.6)1
- Use of background therapy for glycemic management and other control of risk factors were guided by best practice according to local guidelines1
![]()
Body weight: placebo-subtracted mean change from baseline

- Sustained effect for up to 6.5 years1
![]()
Systolic BP: placebo-subtracted mean change from baseline

- Sustained effect for up to 6.5 years1
AHAs=antihyperglycemic agents; BP=blood pressure; CANVAS=Canagliflozin Cardiovascular Assessment Study; CV=cardiovascular; T2D=type 2 diabetes.
Neal et al
The CANVAS Program was an integrated analysis of 2 trials (the CANVAS trial and the CANVAS-R trial) with a total of 10,142 men and women with type 2 diabetes. Of the participants, 96.0% completed the trial and vital status was confirmed for 99.6%. The mean follow-up for the CANVAS Program was 188.2 weeks, while the length of follow-up was 295.9 weeks and 108.0 weeks in the CANVAS and CANVAS-R trials, respectively. Participants were either ≥30 years of age with a history of symptomatic atherosclerotic cardiovascular disease or ≥50 years of age with ≥2 risk factors* for cardiovascular disease. The primary efficacy outcome was a composite of death from cardiovascular causes, nonfatal myocardial infarction, or nonfatal stroke.1
*≥2 of the following risk factors for CVD: duration of diabetes ≥10 years, systolic blood pressure >140 mm Hg while they were receiving ≥1 antihypertensive agents, currently smoking, microalbuminuria or macroalbuminuria, or HDL cholesterol level <1 mmol/L (38.7 mg/dL).
Stenlöf et al
The efficacy and safety of INVOKANA® monotherapy were assessed in subjects with type 2 diabetes mellitus who were inadequately controlled with diet and exercise. In this 26-week, double-blind, placebo-controlled study, 584 adult patients were randomized to receive placebo (n=192), INVOKANA® 100 mg (n=195), or INVOKANA® 300 mg (n=197). Mean baseline A1C values were, respectively, 7.97%, 8.06%, and 8.01%. The primary endpoint was the change in A1C from baseline to week 26. Prespecified secondary endpoints included change in fasting plasma glucose, change in percent body weight, and change in systolic blood pressure.2,3